Last updated on August 18, 2020 — v0.1
Setup
The Windbg debugger plugin is an IDA Pro debugger plugin that uses Microsoft’s debugging engine (dbgeng) that is used by Windbg, Cdb or Kd.
To get started, you need to install the latest Debugging Tools from Microsoft website: Download the Windows Driver Kit (WDK) or from the Windows SDK / DDK package.
Please use ar.exe.idb from samples.zip to follow this tutorial.
After installing the debugging tools, make sure you select "Debugger > Switch Debugger" and select the WinDbg debugger.
Also make sure you specify the correct settings in the “Debugger specific options” dialog:
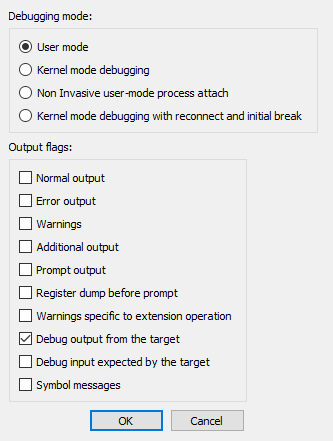
User mode
Select this mode for user mode application debugging (default mode)
Kernel mode
Select this mode to attach to a live kernel.
Non Invasive debugging
Select this mode to attach to a process
non-invasively
Output flags
These flags tell the debugging engine which kind of output messages to
display and which to omit
Kernel mode debugging with reconnect and initial break
Select this option when debugging a kernel and when the connection
string contains 'reconnect'. This option will assure that the debugger
breaks as soon as possible after a reconnect.
To make these settings permanent, please edit the
%IDA%\cfg\dbg_windbg.cfg file.
To specify the debugging tools folder you may add to the PATH
environment variable the location of Windbg.exe or edit
%IDA%\cfg\ida.cfg and change the value of the DBGTOOLS key.
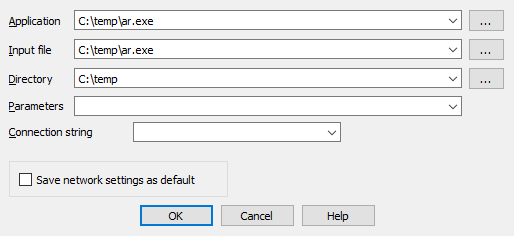
After the debugger is properly configured, edit the process options and leave the connection string value empty because we intend to debug a local user-mode application.
Starting the debugger
Now hit F9 to start debugging:
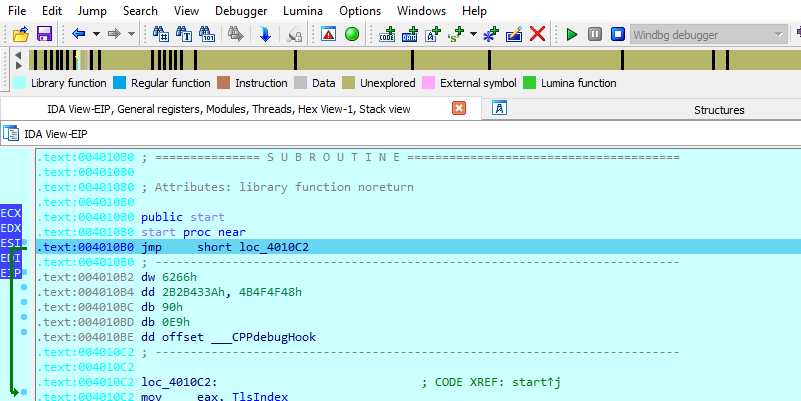
The Windbg plugin is very similar to IDA Pro’s Win32 debugger plugin, nonetheless by using the former, one can benefit from the command line facilities and the extensions that ship with the debugging tools.
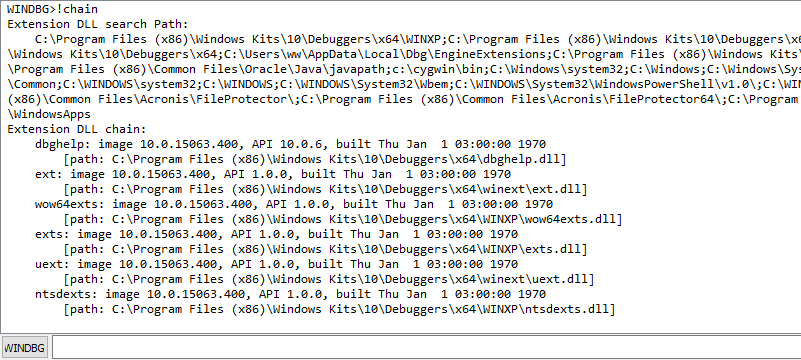
For example, one can type !chain to see the registered Windbg
extensions:
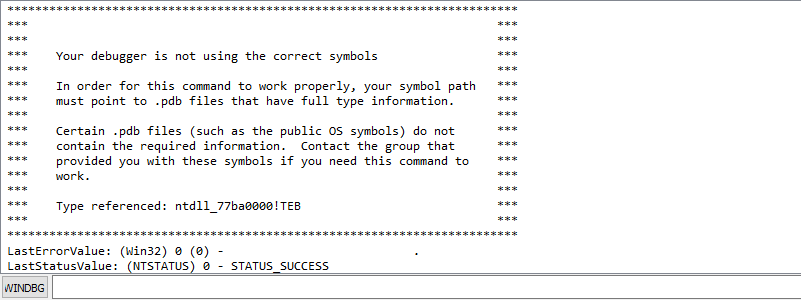
!gle is another command to get the last error value of a given Win32
API call.
Use of symbolic information
Another benefit of using the Windbg debugger plugin is the use of symbolic information.
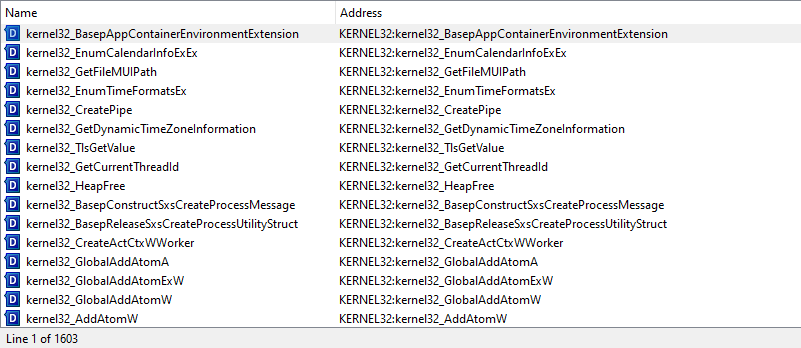
Normally, if the debugging symbols path is not set, then the module window will only show the exported names. For example kernel32.dll displays 1603 names:[^1]
Let us configure a symbol source by adding this environment variable before running IDA:
set _NT_SYMBOL_PATH=srv*C:\temp\pdb*http://msdl.microsoft.com/download/symbols
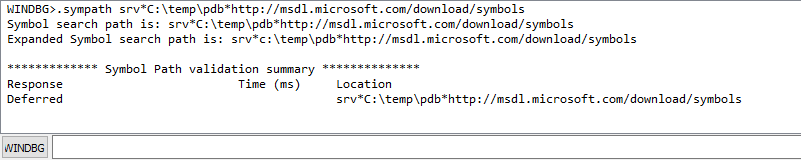
It is also possible to set the symbol path directly while debugging
typing
.sympath srv*C:\temp\pdb*http://msdl.microsoft.com/download/symbols in
the WINDBG console:
and then typing .reload /f /v KERNEL32.DLL to reload the symbols:
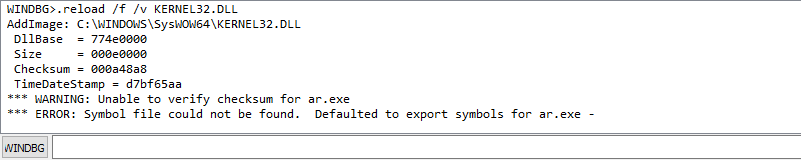
Now we try again and notice that more symbol names are retrieved from kernel32.dll:
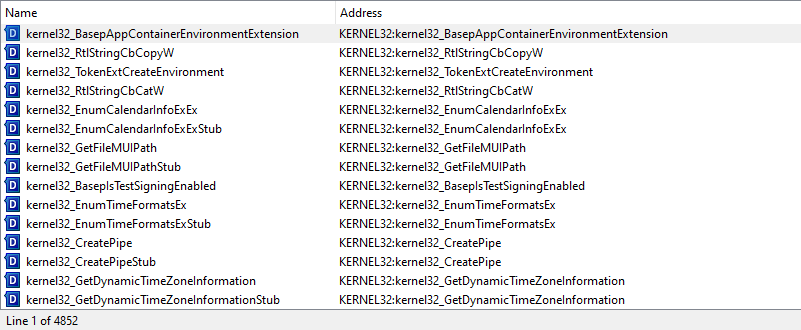
Now we have 4852 symbols instead!
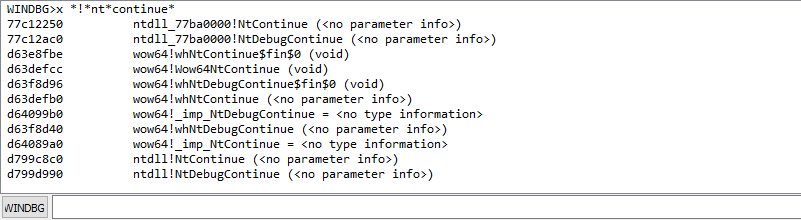
It is also possible to use the x *!*nt*continue [^2] command to
quickly search for symbols:
Debugging a remote process
We have seen how to debug a local user mode program, now let us see how
to debug a remote process. First let us assume that pcA is the target
machine (where we will run the debugger server and the debugged program)
and pcB is the machine where IDA Pro and the debugging tools are
installed.
To start a remote process:
-
On
pcA, type:dbgsrv -t tcp:port=5000[^3] -
On
pcB, setup IDA Pro and Windbg debugger plugin: -
Application/Input file: these should contain a path to the debuggee residing in
pcA -
Connection string:
tcp:port=5000,server=pcA
Now run the program and debug it remotely.
To attach to a remote process, use the same steps to setup pcA and use
the same connection string when attaching to the process.
More about connection strings and different protocols (other than
TCP/IP) can be found in debugger.chm in the debugging tools folder.
[^1]: Double click at KERNEL32.DLL in Modules window to see this
list.
[^2]: Looking for any symbol in any module that contains the word 'continue' after 'nt'
[^3]: change the port number as needed